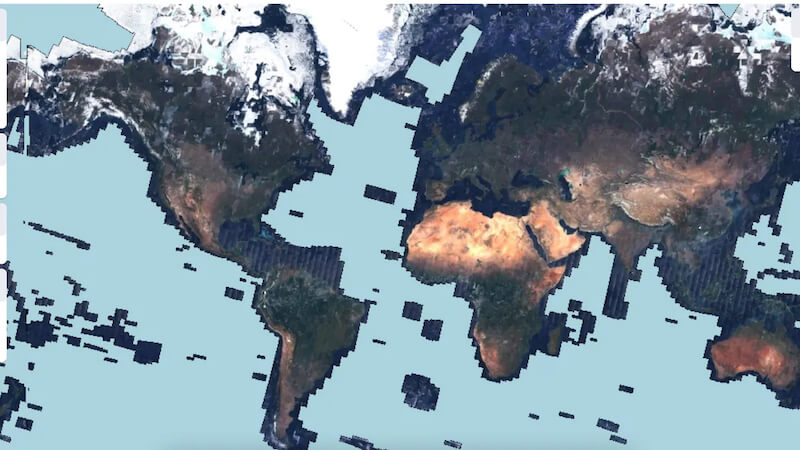
US researchers from the Allen Institute have developed a map to help in the fight against climate change. It shows solar farms and wind turbines, but also changes in tree canopies.
Many nations around the world are setting ambitious goals to fight climate change. In many places, governments are reforesting forest areas or putting more money into expanding wind and solar power. But how can the optimal location and measure be found for future projects?
A new tool from the Allen Institute could now provide information on this. It is based on images from the European Union’s Sentinel-2 satellite. Using artificial intelligence, the researchers developed a feature called Super Resolution. For the first time, this supplements gaps in the detection of renewable energy projects.
Map shows current measures in the fight against climate change
This is because the images shot by the satellite are usually blurred and leave a lot of room for interpretation. Artificial intelligence therefore reads the photographed areas and in turn optimizes the resolution. The end result is a map with unprecedented resolution. The initial focus of the project is to capture all renewable energy projects and forest areas on our planet.
The tool shows, for example, solar farms and wind turbines, but also the change in tree canopies over the past years. Based on this, governments worldwide can plan and commission further measures. The Allen Institute’s software has one advantage: it is available to the public completely free of charge.
Further optimizations and features conceivable in the future
Nevertheless, the project is far from having reached its end. The AI still does not recognize flawlessly which gaps are to be filled with which type of data. For example, the tool sometimes draws abstruse buildings. The reason is that the construction method differs depending on the region. If the model learns that a building is rectangular and the satellite image shows a triangular structure, the result is a wild mixture of both.
Researchers also had to manually input about 36,000 wind turbines, 7,000 platforms, 4,000 solar farms and 3,000 percentages of tree canopies. The next iteration will add an overview that makes the planting of different areas transparent. After all, this data could play a role in preventing food shortages.


